Before it's an app notification, the weather is on the radio. Airwave Scan tunes the NOAA broadcasts, decodes the emergency alert headers for your county, paints the shortwave charts, and tracks the balloons that feed the models.
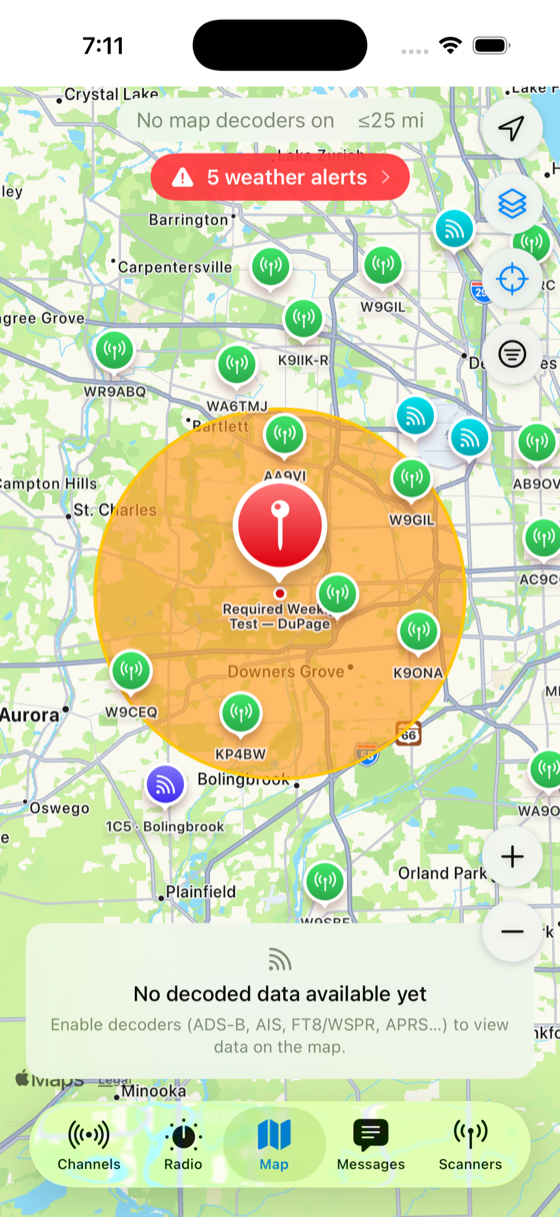
Your county, watchboxed — a decoded SAME alert drawn over its FIPS area, live on the map
The 162 MHz weather channels carry a continuous forecast — and the digital SAME header on the front of every alert says exactly who it's for and until when.

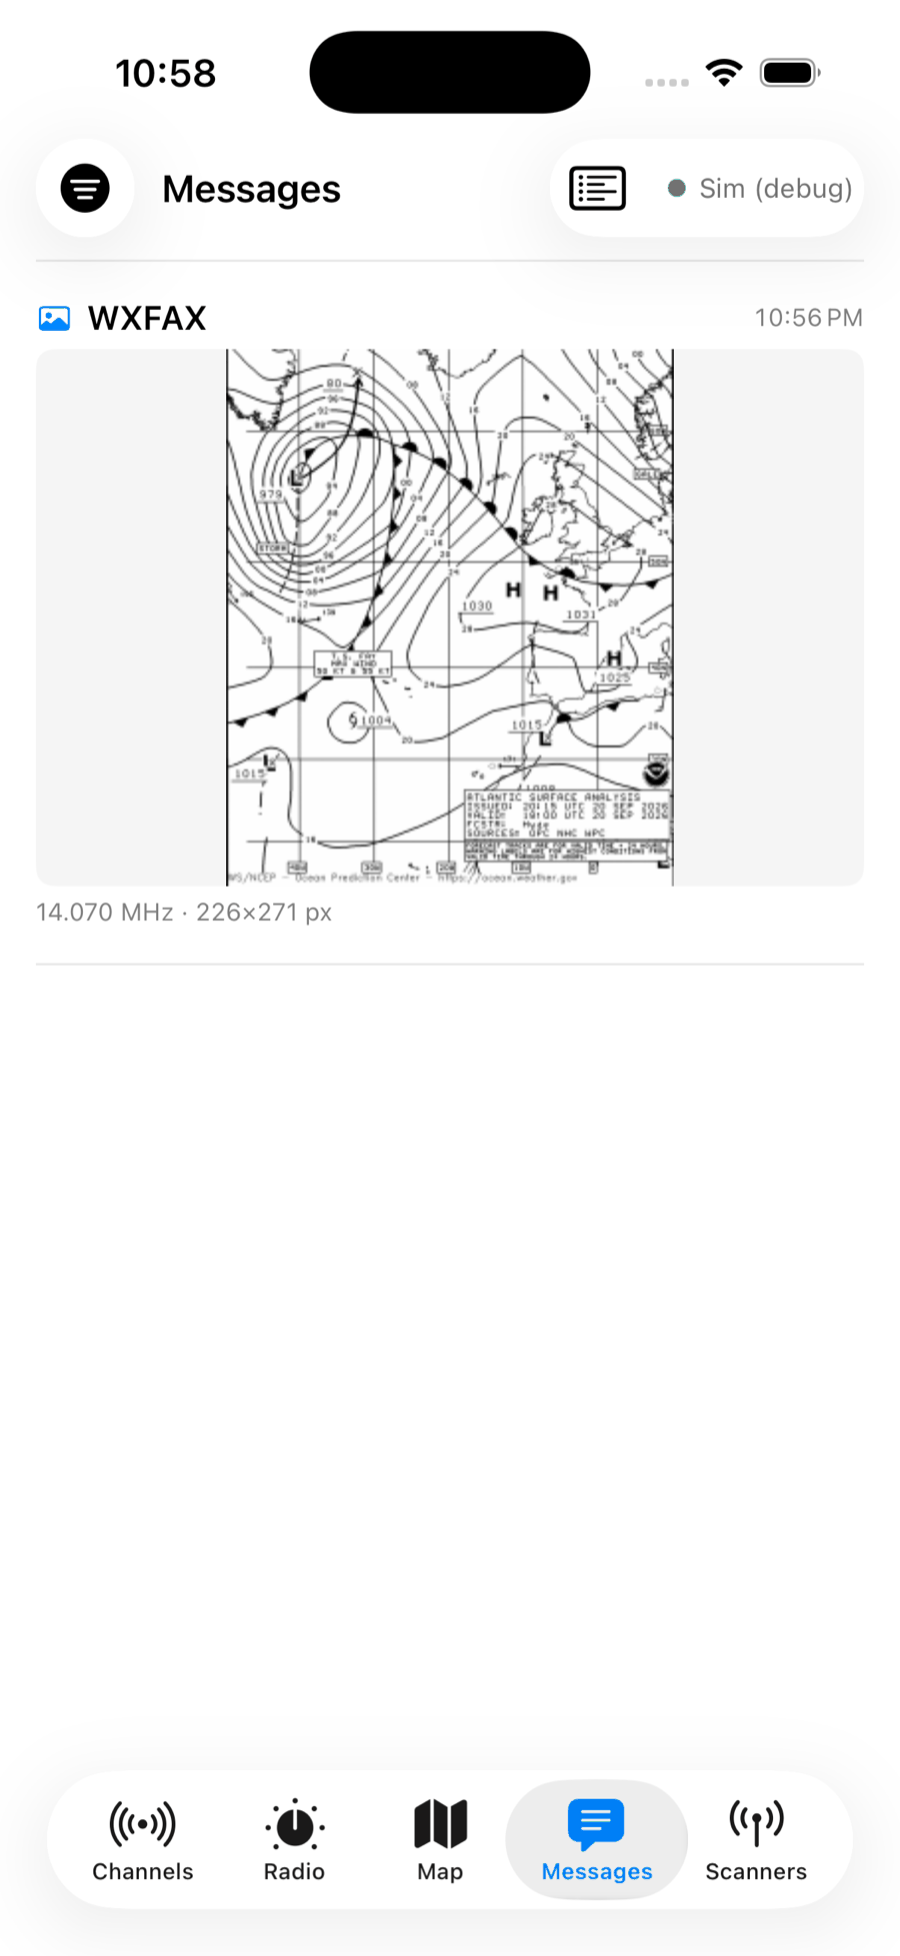
The shortwave fax stations still send the surface analyses and forecast charts that mariners rely on. Watch one build, line by line, and keep it.

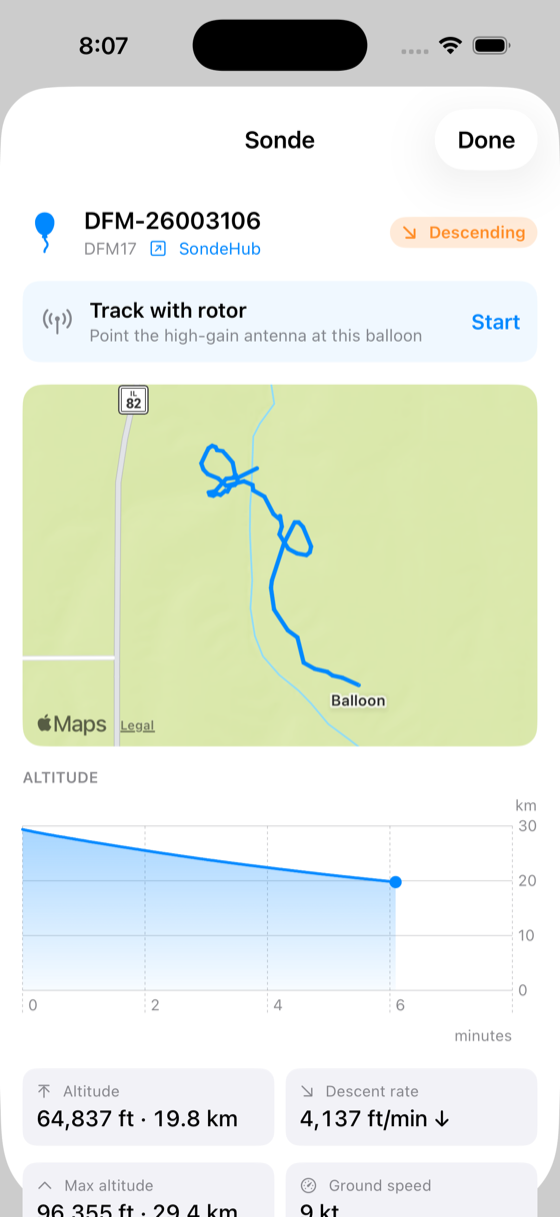
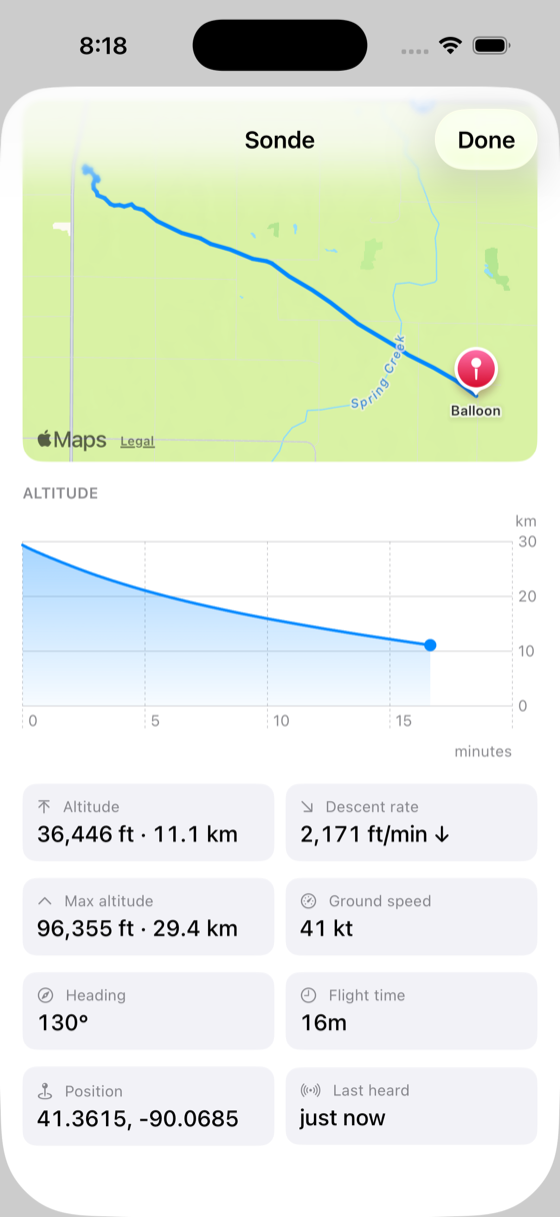
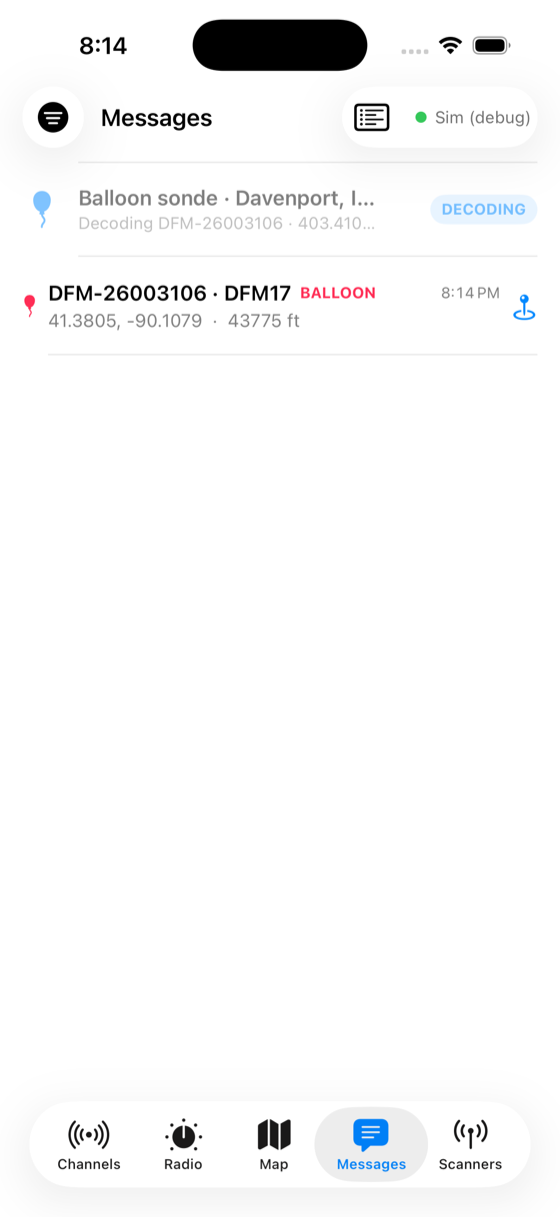
Twice a day, weather services launch balloons that telemeter temperature, humidity and position on the way to the stratosphere. Decode them and plot the climb.
Flight card — the balloon's path, altitude & live telemetry
US ground stations broadcast live NEXRAD radar to aircraft on the 978 MHz UAT datalink (FIS-B). Receive it and paint the storms straight onto your map.
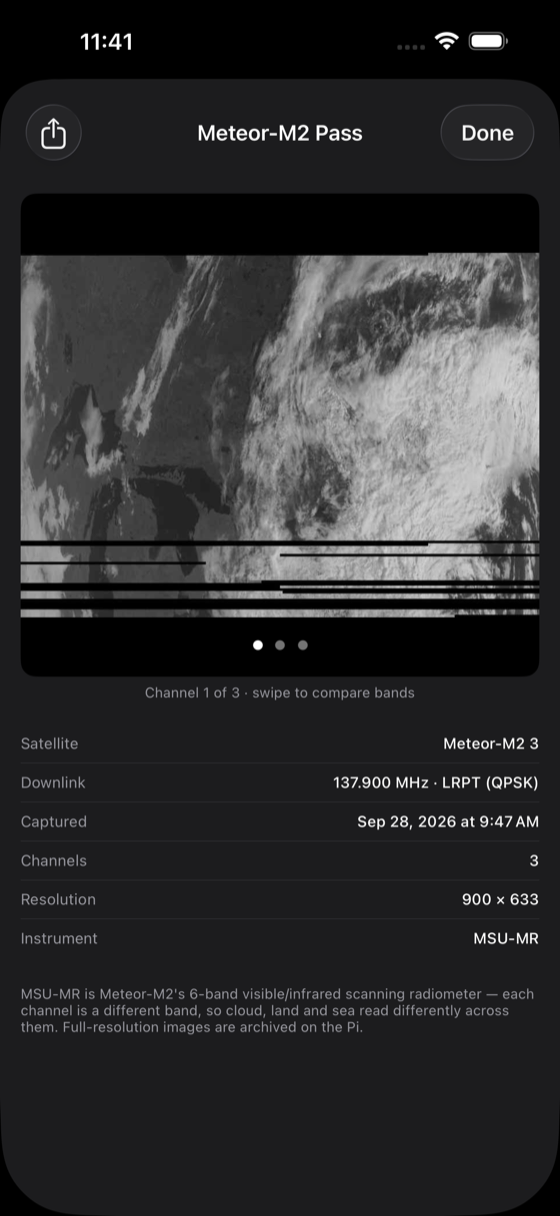
The Meteor-M2 satellites beam down weather imagery on 137 MHz on every pass. The Pi predicts the pass, captures the downlink, and decodes the picture.
Meteor-M2 pass — the decoded picture, right in the app
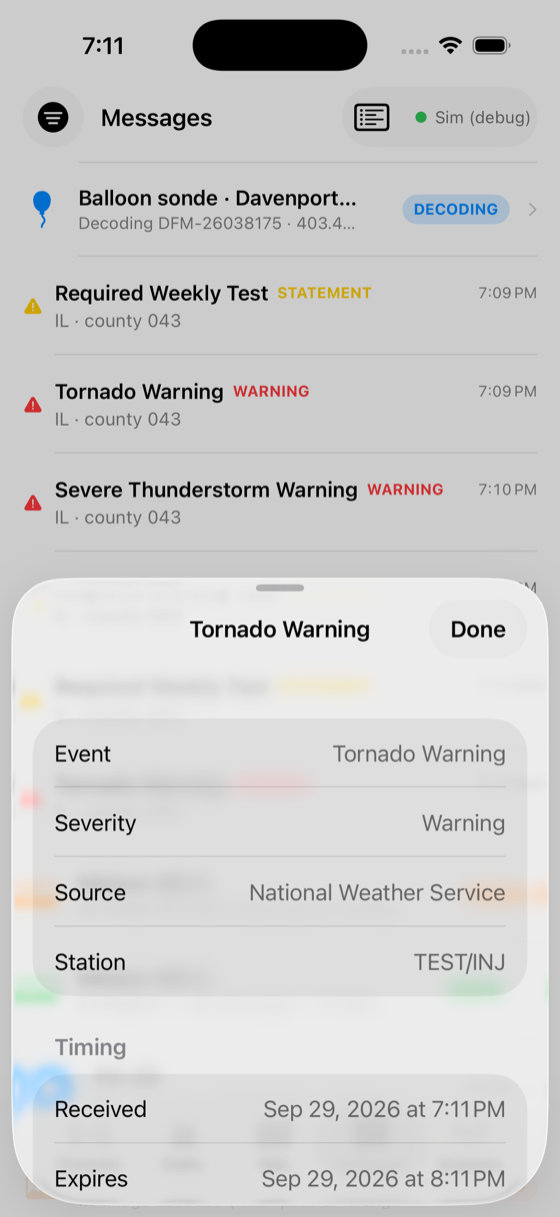
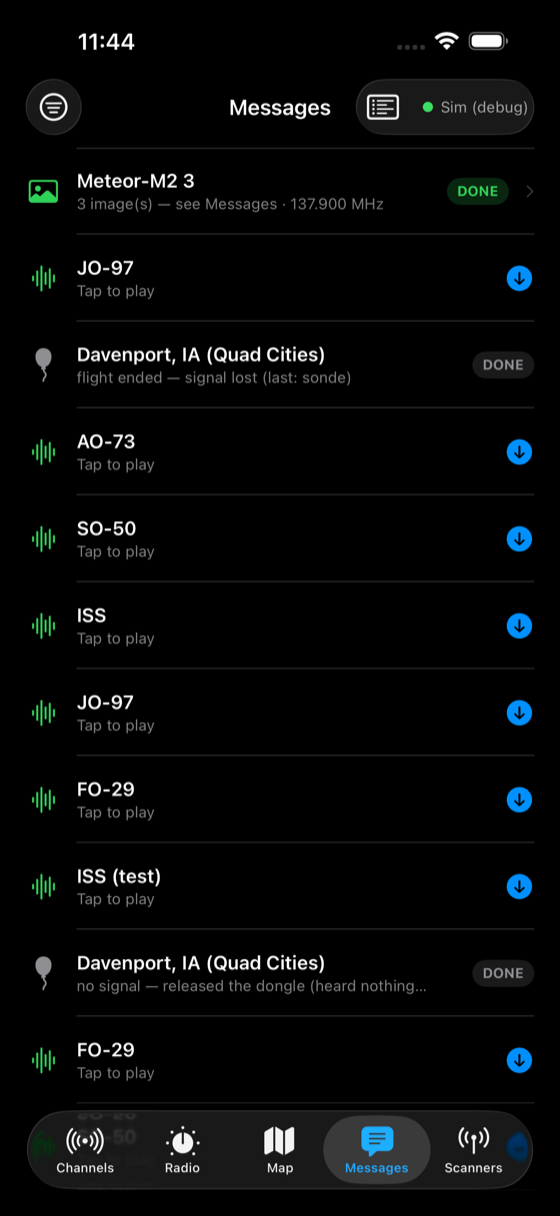
Severe weather doesn't wait for you to be watching the feed. Decoded SAME/EAS warnings for your area are flagged and pushed to the top, with the event, the counties and the expiry right there — so the one message that matters isn't lost in the scroll.
A simple VHF antenna pulls in NOAA and the alerts; add an HF setup for the fax charts and a 400 MHz ear for the sondes — all on one Pi.